

3 Graphs To Help You Decide To Sell
The time is right to list your home.
Looking at the data, you should feel better for listing your home now.
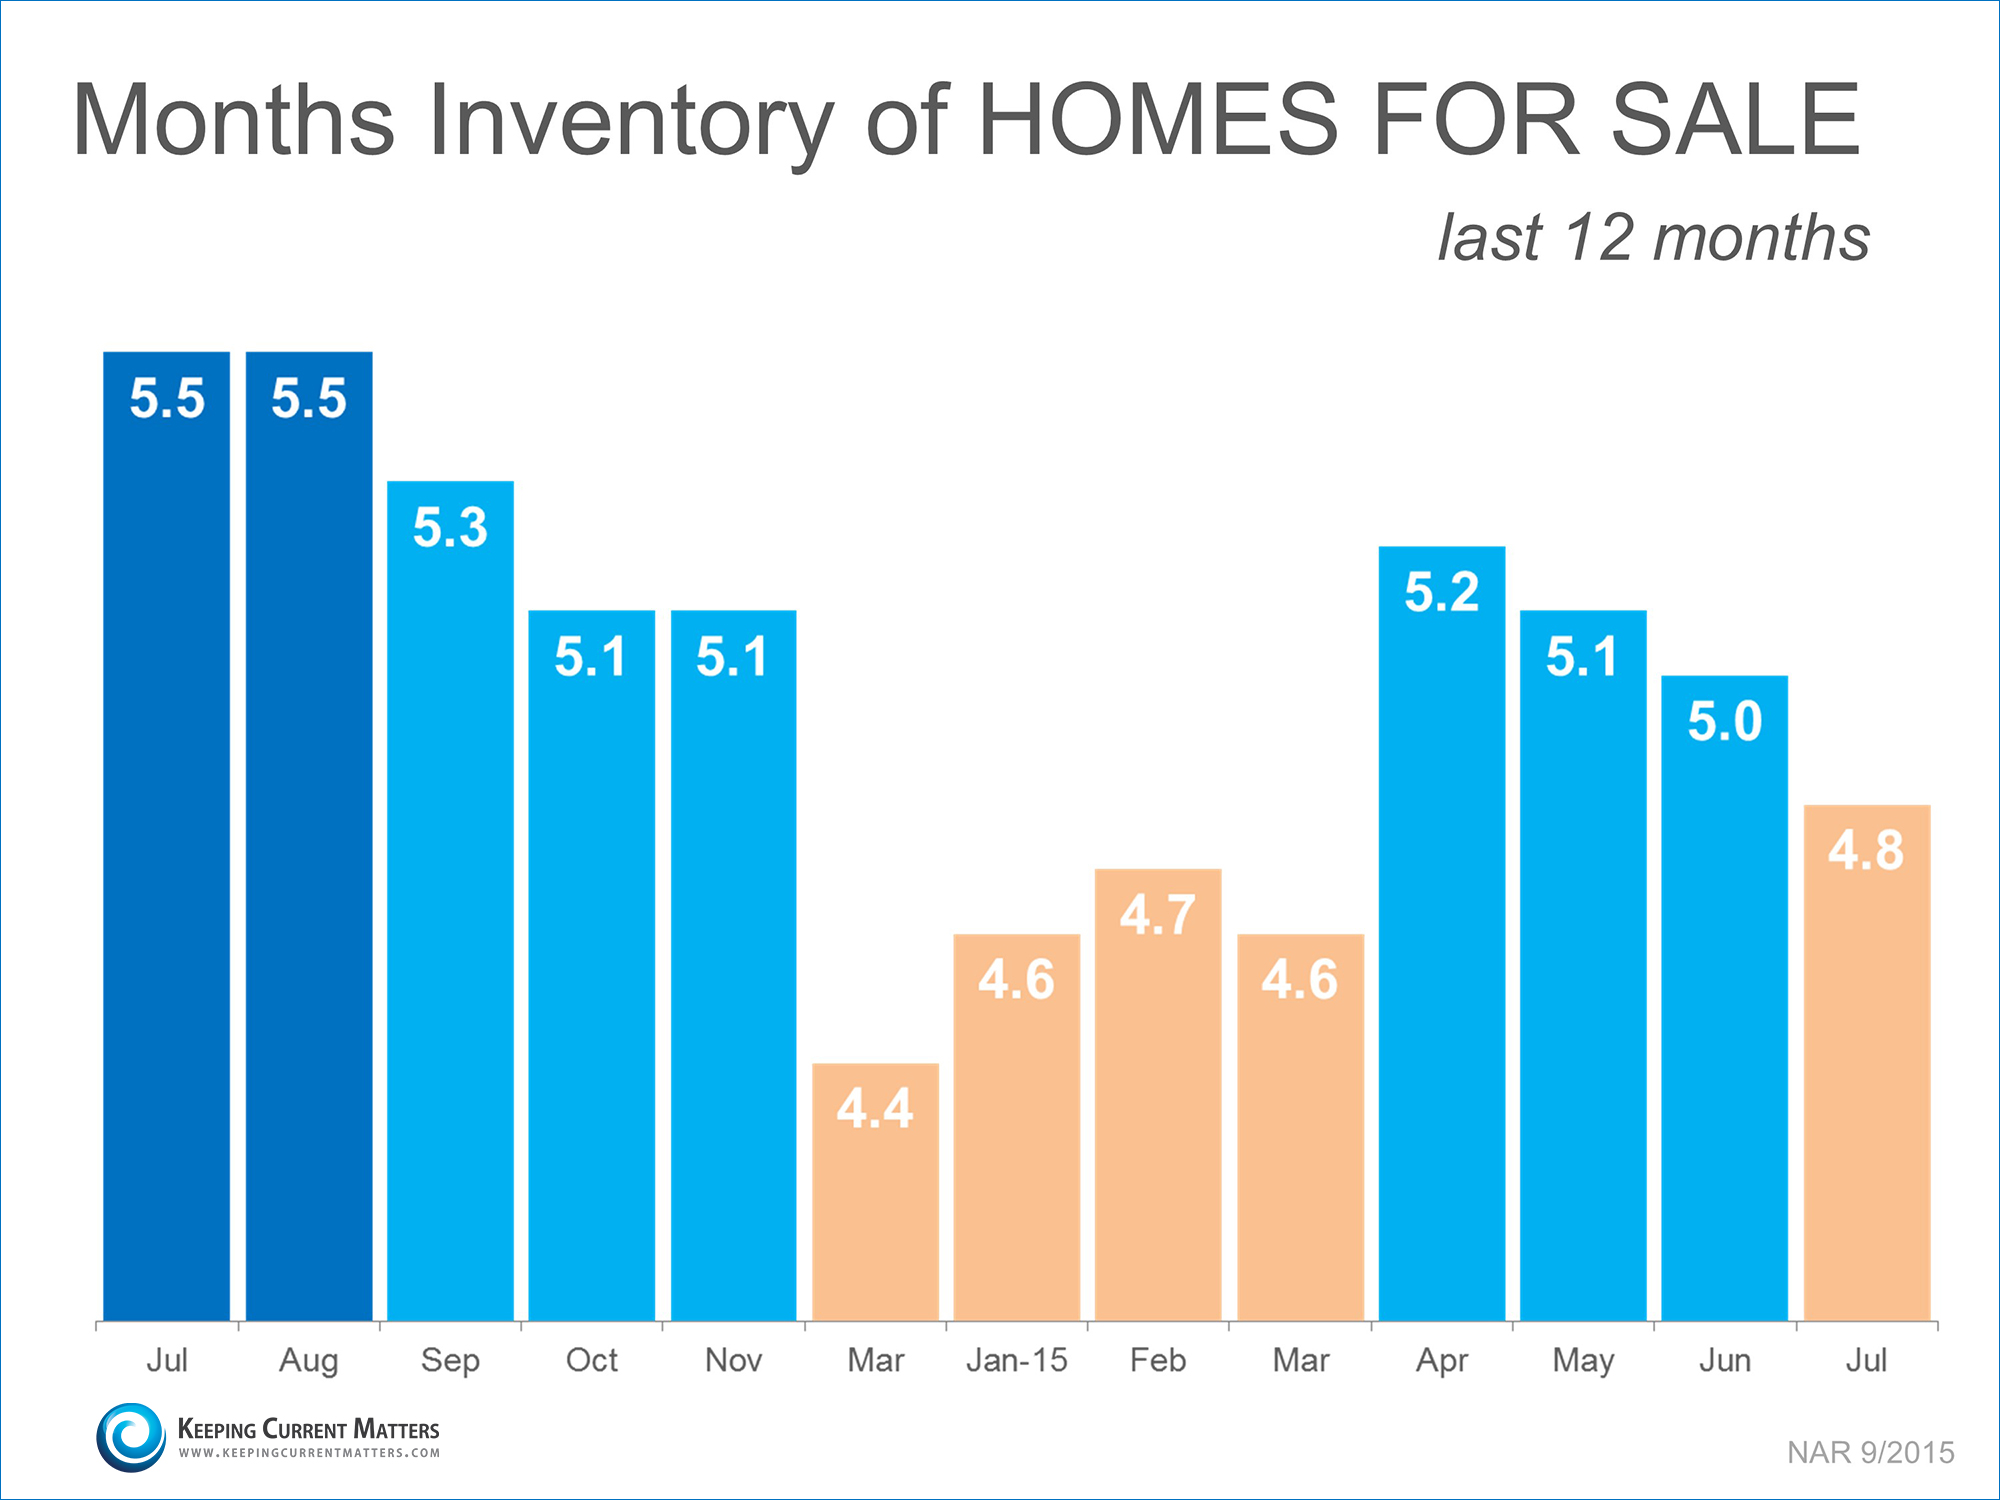
The State of Supply & Demand in Real Estate
You've heard this before: When demand for an item is greater than the supply of that item, you will pay more (or if you're selling that item, you will earn more).
The supply side of Real Estate looks good if you're selling a home.
The National Association of Realtors reports that inventory today is 20% lower than the normal 6 months inventory of a normal market.
Check out the data below:
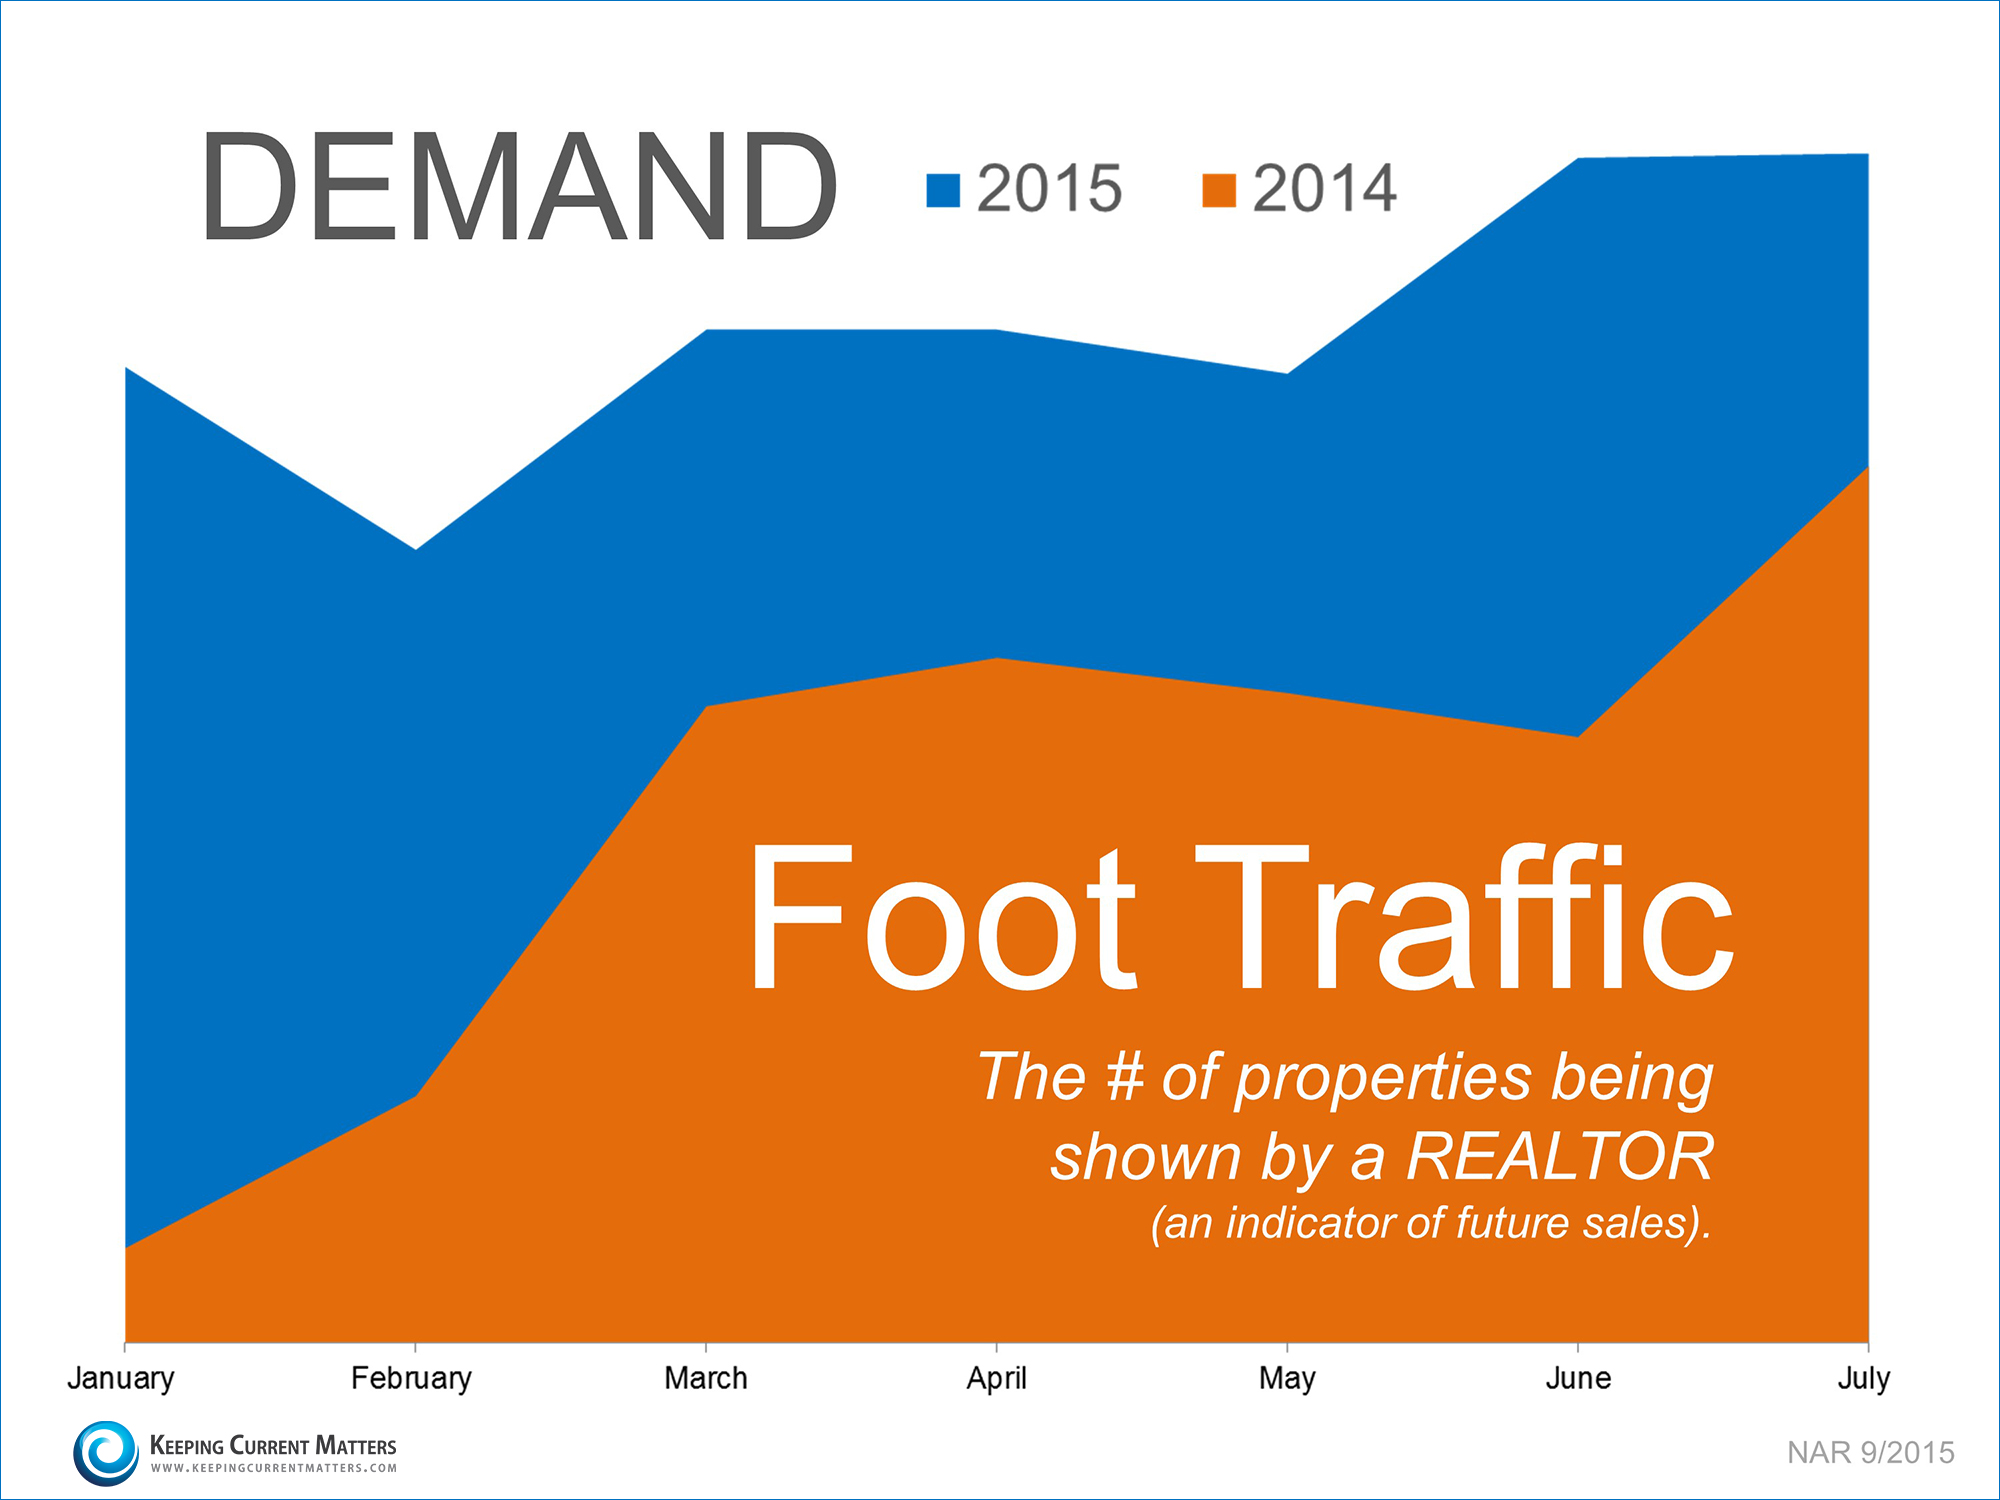
On the demand side, the number of properties being shown by a REALTOR, as measured by foot traffic, is much greater than 2014 levels.
The chart below shows that selling a home today means that you can expect solid demand. Buyers are competing against each other which places your listing in a perfect place.
The supply and demand figures say it's a great time to sell.
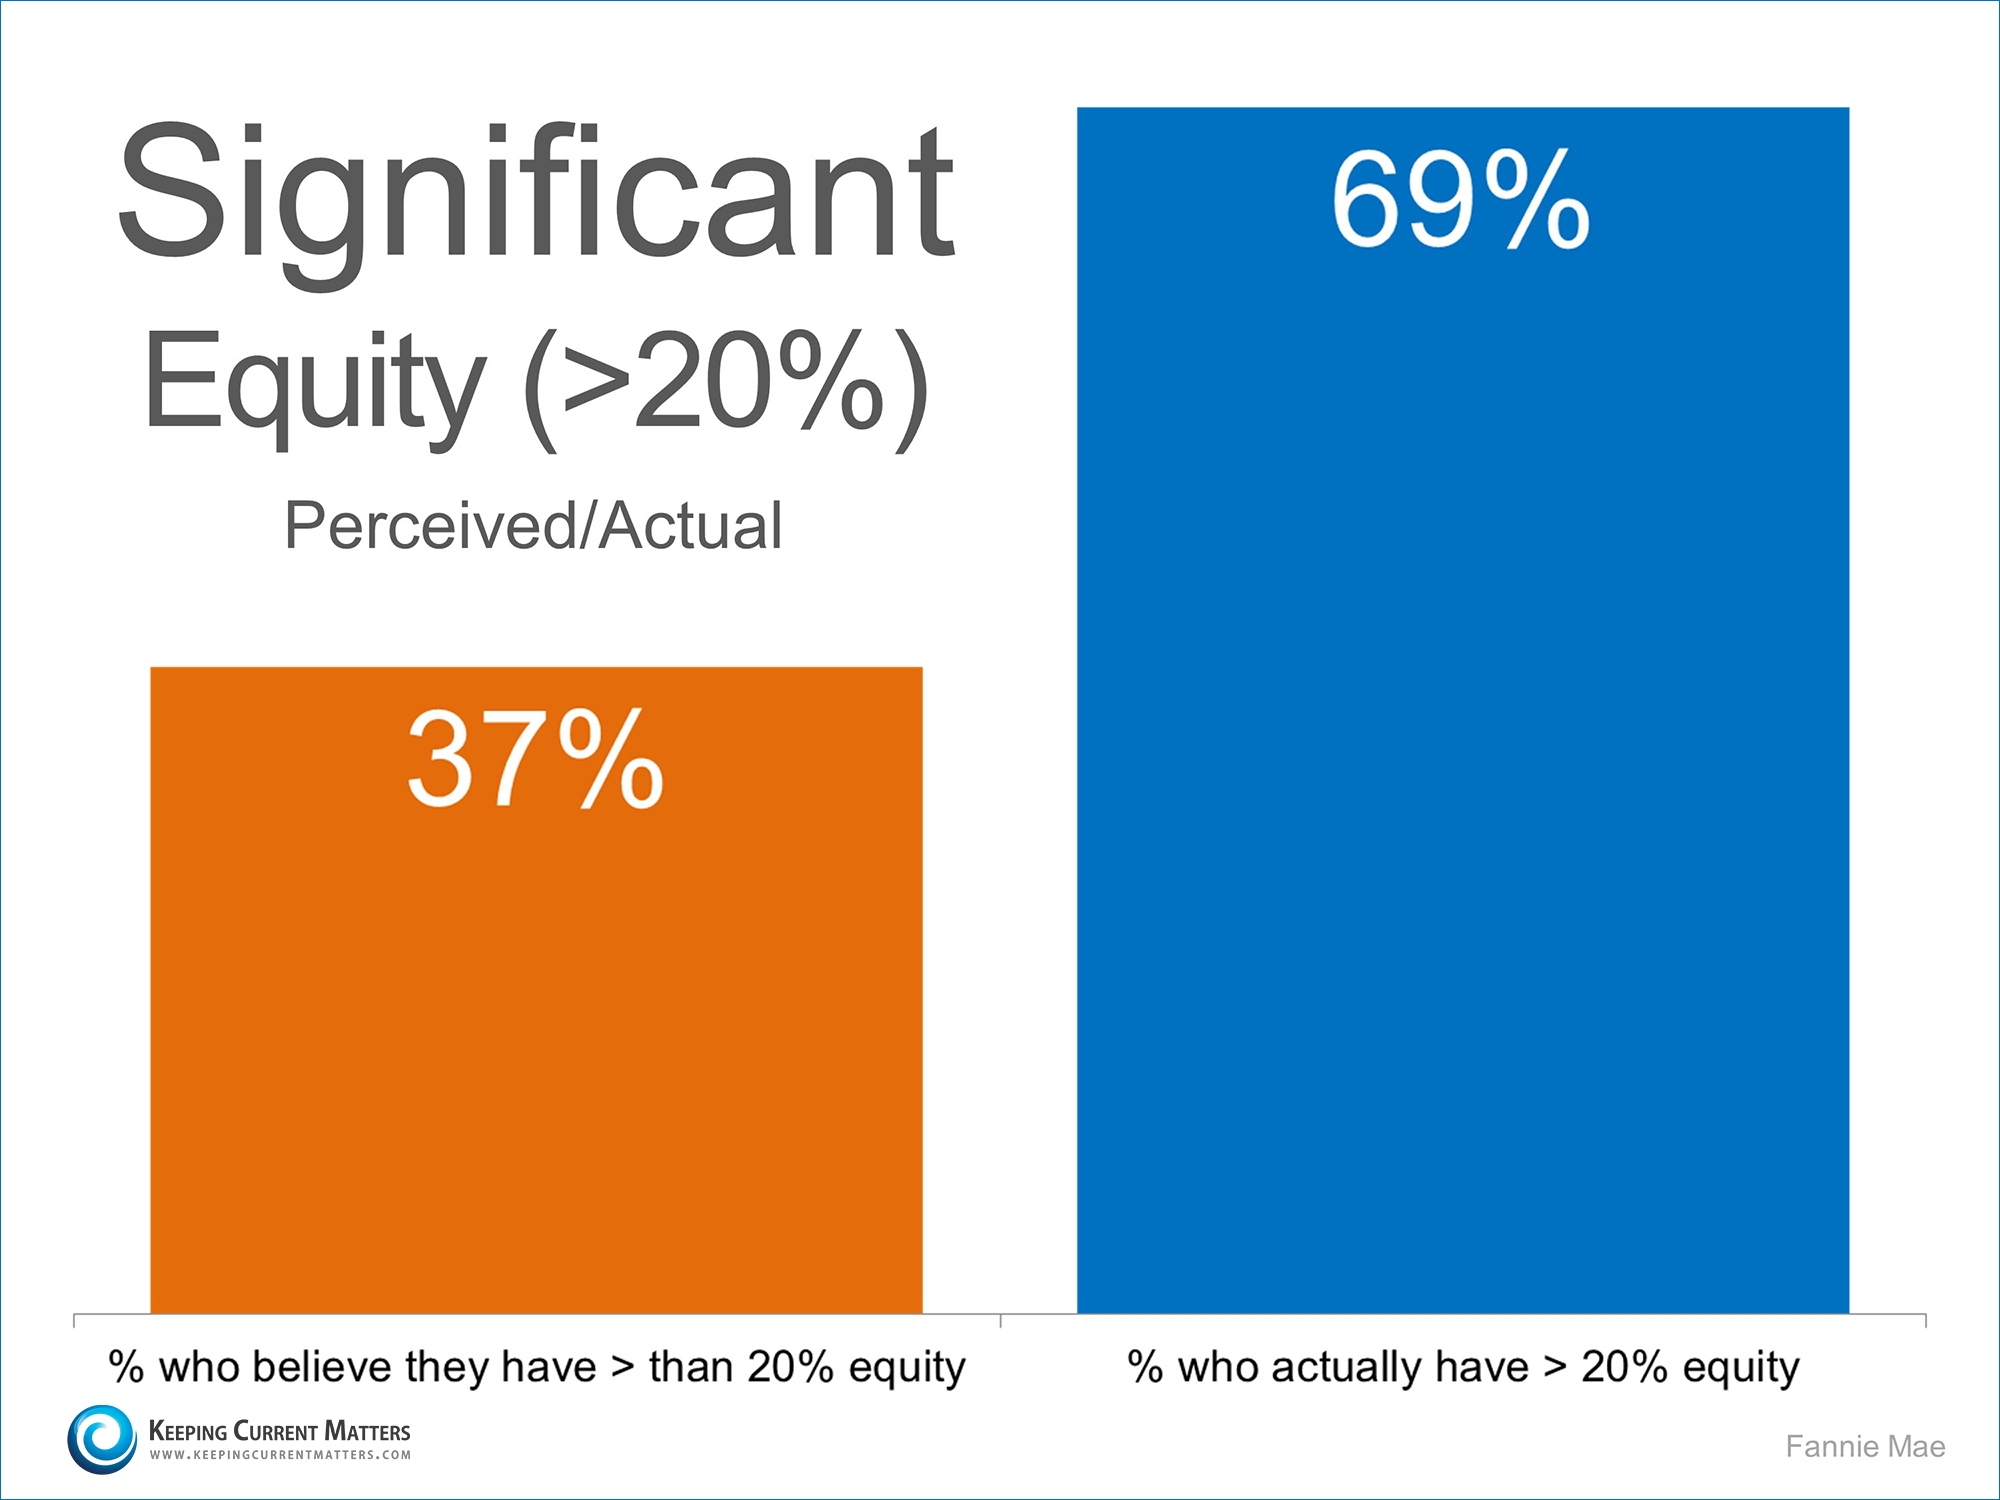
Maybe you're worried though about the home equity side. Although only 37% of homeowners believe that they have more than 20% equity in their home, the reality is that 69% do.
So what are you waiting for? Contact Skyrise Real Estate Group and watch our negotiation skills work for you.